
Strategies for Sustainable Enrollment Growth in Higher Education
The Evolving Landscape of Higher Education Enrollment
The world of higher education is constantly changing. Following a period of shifting enrollment and a post-pandemic rebound, a clear trend emerges. The focus is no longer just on attracting new students. It is now equally about keeping them and helping them succeed. This means understanding every step of their journey.
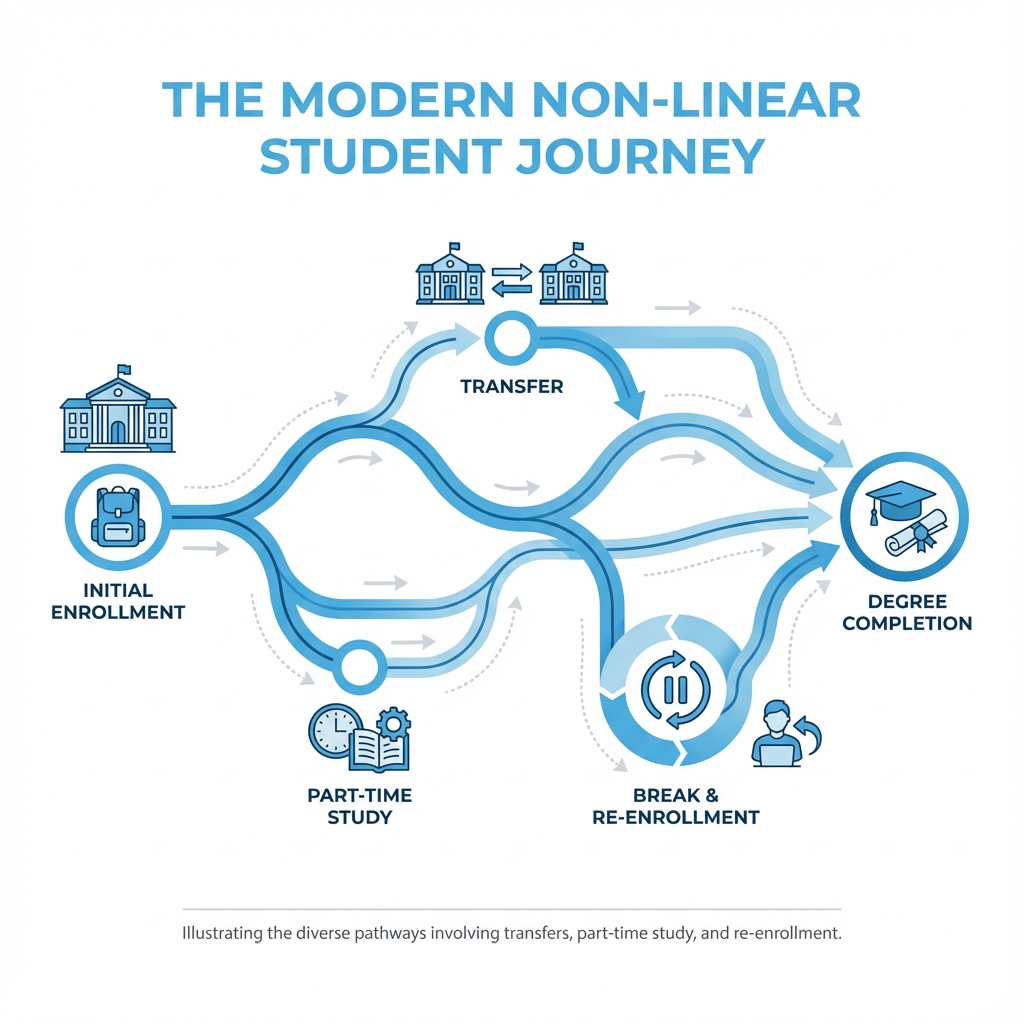
We believe that student success data is key to this new approach. It helps us see the complete picture of a student's path. This path is rarely straight. It often includes transfers, part-time study, and even re-enrollment. By using this data, institutions can build stronger, more lasting growth.
We will explore the critical role of student success data. We will examine how it enables us to measure outcomes beyond traditional methods. We will also examine how leading institutions use data to support all students. Our goal is to demonstrate how a data-driven approach can foster a more equitable and effective educational experience for all.

The higher education landscape is in constant motion, shaped by dynamic demographic shifts and evolving student expectations. We are witnessing a significant change in who attends college and how they pursue their degrees. Today's student body is increasingly diverse, comprising a growing number of part-time students, adult learners, and first-generation college-goers. These “post-traditional” students often juggle multiple responsibilities, including work and family commitments, making flexibility and custom support paramount. For instance, recent data indicate that nearly one-third (32.6%) of part-time students did not return for their spring semester, and almost half (46.8%) failed to persist into their second fall term, highlighting the unique challenges this demographic faces. This is in stark contrast to full-time students, 92.1% of whom returned for the spring semester.
The impact of initiatives like free community college programs is also reshaping enrollment patterns, driving significant growth in specific segments. In Massachusetts, for example, fall 2024 saw a +6.5% increase in undergraduate enrollment system-wide, primarily driven by community colleges due to expanded free tuition programs. This demonstrates how policy and accessibility directly influence student populations and, consequently, the data we collect on their success.

Key Challenges Impacting Higher Education Enrollment Today
While enrollment figures may fluctuate, persistent equity gaps remain a critical challenge within higher education. Data consistently reveal disparities in success outcomes for various student groups. Underrepresented groups, including Hispanic, Black, and Native American students, often experience retention rates below the national average. By the second fall, their retention rates were 65.4%, 58.5%, and 56.0%, respectively, compared to the national average of 69.5%. Similarly, Pell Grant recipients and first-generation students frequently face additional barriers to persistence and completion.
These challenges are often multifaceted, encompassing financial difficulties, health and well-being concerns, and a lack of a strong sense of belonging within the institutional community. For instance, the University of Arizona identifies finances, health/well-being, and not feeling a sense of belonging as the top reasons students cite for leaving. Addressing these complex issues requires a nuanced understanding derived from comprehensive data on student success.
The Shift from Traditional to Holistic Success Metrics
Historically, measuring student success in higher education primarily relied on the federal graduation rate, which focused almost exclusively on full-time, first-time (FTFT) bachelor ‘s-seeking students completing their degrees at the institution where they started. This narrow scope, however, failed to capture the realities of an increasingly mobile and diverse student population.
Recognizing this limitation, reporting systems have evolved to address it. The Integrated Postsecondary Education Data System (IPEDS) now offers more comprehensive measures beyond its traditional Graduation Rates (GR) and Graduation Rates 200% (GR200). Its Outcome Measures (OM) component, for example, collects completion outcomes for all entering degree- or certificate-seeking undergraduates, including non-first-time and part-time students, extending the observation period to eight years after entry. This provides a much fuller picture of student pathways, as detailed in the NCES guide on Measuring Student Success in IPEDS.
Another crucial development is the Student Achievement Measure (SAM), a national project designed to expand standard metrics. SAM tracks student movement across postsecondary institutions, providing a more complete picture of undergraduate student progress and completion within the higher education system. It includes a “graduated anywhere” metric, acknowledging that students may transfer and complete their degrees at another institution. This is vital, as SAM data shows that while 69% of first-time full-time students completed their bachelor’s degree at their starting institution, an additional 9% completed their degree after transferring elsewhere. This broader view is also accepted by accrediting bodies like the Higher Learning Commission (HLC), which now emphasizes continuous improvement in student success outcomes, considering diverse student populations and peer benchmarks. HLC's revised Criteria for Accreditation (effective September 1, 2025) includes a specific Core Component 3.G on Student Success Outcomes, underscoring the importance of these holistic metrics as outlined in their guide for providing evidence to support the revised criteria.
Here's a comparison of traditional versus modern student success metrics:
Metric Type Traditional Metrics (e.g., IPEDS GR) Modern Metrics (e.g., IPEDS OM, SAM) Student Cohort Full-time, First-time (FTFT) bachelor's-seeking students only All degree/certificate-seeking undergraduates (FTFT, non-FTFT, part-time) Institution Completion at the starting institution only Completion at starting institution or any subsequent institution Timeframe Typically 150% of normal time (e.g., 6 years for a 4-year degree) Up to 8 years after entry Outcomes Tracked Graduation at starting institution Highest credential earned, enrollment status for non-completers Scope Limited, often referred to as “traditional” students Comprehensive, reflects diverse student pathways
Leveraging Data to Drive Sustainable Growth
To truly foster sustainable enrollment growth, institutions must cultivate a robust data-driven culture. This involves moving beyond simply collecting data to actively analyzing it, democratizing access across campus, and changing insights into actionable strategies. The goal is to shift from relying on lagging indicators, such as final graduation rates, to embracing leading indicators that allow for earlier intervention and proactive support. First-semester persistence, for example, is a critical early indicator; more than 86% of first-time college students from the fall 2023 cohort returned for their second semester, highlighting the importance of this initial period as noted in the National Student Clearinghouse Research Center’s Persistence and Retention Report.
Institutional research plays a pivotal role in this process, providing the expertise to gather, interpret, and disseminate meaningful data. However, the true power of data is released when it's accessible and understandable to faculty, staff, and administrators across all departments. This democratization of data enables a collective understanding of student needs and challenges, fostering a campus-wide commitment to student success.
Using Data to Understand and Support At-Risk Populations
Disaggregating student success data by demographics is crucial for identifying and addressing specific vulnerabilities that may exist within certain groups. The National Student Clearinghouse (NSC) Persistence & Retention Report offers invaluable insights into these trends. We know that part-time students face significantly greater risks of not continuing their studies, with nearly one-third not returning for the spring semester. Similarly, first-time students aged 25 and older are less likely to persist, with over one in four full-time students in this age group not returning for either the spring or their second fall term.
Retention rates for Hispanic, Black, and Native American students also consistently remain below the national average, underscoring the need for targeted interventions. By carefully analyzing these data points, institutions can pinpoint which groups are most at risk and why, moving beyond broad assumptions to precise, evidence-based solutions. This approach is central to the recommendations in the U.S. Department of Education's playbook, “Using Data Effectively to Drive Equitable Improvements in Postsecondary Student Success.”
Key risk indicators for first-year students often include:
- Low academic performance in early courses: Struggling with foundational subjects can quickly demotivate students.
- Lack of engagement: Limited participation in campus activities, clubs, or academic support services.
- Financial strain: Difficulty affording tuition, fees, or living expenses, often leading to reduced enrollment or withdrawal.
- Low sense of belonging: Feeling isolated, disconnected, or undervalued within the university community.
- Part-time enrollment status: Juggling external responsibilities often makes it harder to commit fully to studies.
- First-generation status: Navigating the complexities of higher education without familial experience or guidance.
- Older student status (25+): Balancing academic pursuits with established career and family obligations.
- Transfer student status: Facing challenges with credit transfer, integration into a new campus culture, or finding relevant support.
From Data to Action: Building a Data-Informed Support System
This data-driven approach enables institutions to transition from reactive problem-solving to proactive support, resulting in a more seamless student journey. Effectively managing the entire lifecycle, from initial inquiry to post-graduation success, is fundamental. A deep understanding of the Archer higher education enrollment funnel, powered by analytics, enables institutions to identify and address potential drop-off points before they become critical issues.
For example, institutions can implement early-warning systems that utilize predictive analytics to identify students exhibiting risk factors – such as a decline in grades, missed assignments, or reduced engagement with online learning platforms. This allows advisors and support staff to reach out proactively, offering personalized guidance before a student falls too far behind. Proactive advising, informed by a holistic view of the student's academic and personal circumstances, can guide them to appropriate resources, whether it's academic tutoring, mental health services, or financial aid counseling.
Wraparound services, designed to address both academic and non-academic needs, are essential. This could include childcare support for adult learners, culturally competent counseling for underrepresented groups, or career development workshops custom to specific program pathways. The goal is to build a comprehensive ecosystem of support that anticipates student needs and removes barriers to their success, ensuring that every student has the opportunity to thrive.
Frameworks for Success: Linking Equity and Enrollment
The most forward-thinking institutions recognize that true excellence in higher education cannot be achieved without a steadfast commitment to equity and diversity. This perspective frames equity not merely as a moral imperative but as an intrinsic component of institutional success and sustainable enrollment.
The University of California's ‘Equity is Excellence' framework exemplifies this philosophy. It asserts that achieving excellence is impossible without prioritizing and embedding equity in all strategies and operations. Similarly, the Massachusetts public higher education system employs ‘Targeted Universalism' in its Strategic Plan for Racial Equity, setting goals that aim to be met not only for the entire student body but also for every subgroup, with a particular focus on those historically underserved. The University of Wisconsin-Madison, for instance, also makes a wide array of student achievement data publicly available, fulfilling transparency and accountability requirements.
This commitment to equity translates into tangible strategies:
- Redesigning Gateway Courses: Data often reveals that introductory “gateway” courses act as unintentional gatekeepers, disproportionately hindering the progress of particular student populations. Redesigning these courses to be more inclusive, accessible, and engaging can significantly improve retention and progression.
- Paid Experiential Learning: Experiential learning opportunities, such as research or internships, are invaluable but often inaccessible to low-income students who need to work to support themselves. Programs that offer paid experiential learning remove this financial barrier, ensuring all students can benefit.
- Academic Recovery Models: Transitioning from punitive “academic probation” to supportive “academic recovery” models can help normalize the use of academic support services and assist students in getting back on track without stigmatization.
Case Study: The University of California's UC 2030 Goals
The University of California's UC 2030 initiative is a powerful example of how an extensive system can strategically link equity and excellence. The ambitious goals include increasing the number of graduates by 1.2 million, achieving a ninety percent overall graduation rate, and critically, eliminating equity gaps for low-income, first-generation, and underrepresented students. More details on this framework can be found in the UC 2030: Equity is Excellence Executive Summary.
The UC system leverages data extensively to drive these goals. Data tools are not just for administrators but are also deployed for instructors to help them understand student demographics and course outcomes, identifying and addressing learning barriers. Holistic advising software supports a “whole student” approach, providing advisors with comprehensive insights to offer personalized guidance. Significant efforts are also directed towards improving the success of transfer students, recognizing their unique pathways, and bolstering first-year retention initiatives for all students. For freshmen entering in 2022, first-year retention rates increased by one percentage point overall, and more than doubled for underrepresented groups (Black, Latinx, and Native American students). Retention rates for transfer students have also increased, exceeding 93 percent for all students, including those from low-income, first-generation, or underrepresented backgrounds, for the first time since the pandemic. These statistics demonstrate the tangible impact of a data-informed, equity-focused strategy.
Case Study: Massachusetts' Strategic Plan for Racial Equity
The Massachusetts public higher education system's Strategic Plan for Racial Equity (SPRE) provides another compelling framework for action. The plan sets system-level completion goals and segment-specific targets for community colleges, state universities, and the University of Massachusetts campuses. For example, the system-level completion rate for students who entered in fall 2017 was 55.1% by 2023, with a goal of 60% by 2033. Within this, the community college segment aims for a 40% completion rate by 2033 (up from 34.0%), state universities for an 80% completion rate (up from 69.0%), and UMass for an 85% completion rate (up from 77.4%). These insights are drawn from the Massachusetts Department of Higher Education's analysis of enrollment and success trends.
A core tenet of the SPRE is tracking first-year momentum metrics, such as on-time credit accumulation and persistence to the second fall, as early indicators of long-term success. Crucially, the plan emphasizes addressing disparities for Black, Latino, and Pell recipient students, disaggregating all data to highlight and close these equity gaps. The commitment to “Targeted Universalism” means that while universal goals are set, specific, targeted supports are implemented to ensure that every subgroup achieves or exceeds those goals.
Key metrics from the MA SPRE include:
- On-Time Credit Accumulation: The percentage of first-year students completing a certain number of credits within their first year, indicating early academic momentum.
- Persistence to 2nd Fall: The percentage of first-year students who re-enroll for their second fall term is a crucial indicator of early retention.
- Transfer to Baccalaureate: For community college students, the rate at which they successfully transfer to a four-year institution.
- Completion After Transfer: The rate at which students who transfer from a community college complete a baccalaureate degree.
- Completion Anywhere: The percentage of students who complete a degree or credential at their starting institution or any other institution they subsequently attend.
These examples demonstrate how strategic, data-driven approaches, deeply rooted in equity principles, are crucial for promoting student success and, by extension, achieving sustainable enrollment growth.
Frequently Asked Questions about Student Success Data
What are the most critical metrics for measuring student success today?
Beyond traditional graduation rates, institutions now focus on a more comprehensive suite of metrics. Persistence (continued enrollment anywhere across the higher education system), retention (continued enrollment at the initial institution), and completion rates are paramount. Metrics from systems like the Student Achievement Measure (SAM) and IPEDS Outcome Measures (OM) provide a more holistic view by tracking part-time, transfer, and non-traditional students over more extended periods (up to eight years). This expanded view acknowledges the diverse and often non-linear paths students take to achieve their educational goals, capturing success that traditional federal reporting might miss. Tools like VSA Analytics provide institutions with exclusive access to compare their data on SAM and other key performance indicators against those of their peers.
How do student demographics influence success rates?
Data consistently shows significant disparities based on student demographics. Part-time students and adult learners (aged 25 and above) face a higher risk of dropping out, often due to balancing academic pursuits with work and family responsibilities. For example, nearly one-third of part-time students did not return for their spring semester. Similarly, retention and completion rates for Black, Hispanic, and Native American students often lag behind the national average. First-generation and Pell Grant-recipient students may also require more targeted support to overcome systemic barriers, such as financial constraints, a lack of institutional knowledge, or a lower sense of belonging, to achieve parity in outcomes. Understanding these demographic influences is crucial for developing equitable support strategies.
How can institutions use data to improve retention and completion?
Institutions leverage student success data in multiple powerful ways. Firstly, data powers early-alert systems that flag at-risk students based on factors such as academic performance, attendance, or engagement, allowing for timely and proactive interventions. Secondly, analytics help identify institutional barriers, such as “gateway” courses with disproportionately high failure rates, leading to curriculum redesigns that make learning more accessible and equitable. Thirdly, data informs the development of holistic advising models, targeted financial aid, and comprehensive wraparound support services (e.g., mental health, food security, career counseling) designed to address the specific academic and non-academic needs of diverse student populations. By continuously analyzing the effectiveness of these interventions, institutions can refine their strategies for continuous improvement.
Conclusion
The journey towards sustainable enrollment growth in higher education is inextricably linked to our commitment to student success and equity. As we've explored, the landscape has evolved, demanding a shift from narrow, traditional metrics to holistic, data-driven approaches that capture the whole, often complex, student journey. Institutions that accept this paradigm, leveraging sophisticated data analytics to understand and support every student, are the ones that will thrive.
By disaggregating data, identifying critical risk factors, and implementing proactive, personalized interventions – from redesigned gateway courses to paid experiential learning and academic recovery models – we can dismantle systemic barriers and foster environments where all students, regardless of their background or pathway, can achieve their full potential. The examples of the University of California's ‘Equity is Excellence' framework and Massachusetts' Strategic Plan for Racial Equity demonstrate that ambitious, data-informed goals can lead to tangible improvements in graduation rates, retention, and the closing of persistent equity gaps.
The future of higher education hinges on our ability to transform insights into action. Data is not merely a reporting tool; it is the foundational intelligence that empowers us to make informed decisions, innovate our support systems, and ultimately fulfill the promise of higher education to provide upward mobility and societal contribution for all. By placing student success data at the heart of our strategies, we build not just stronger institutions but a more equitable and prosperous future.
- Smart Energy Upgrades: A Direct Look at What Works - February 13, 2026
- How to Give Your Brain More Daily Stimulation - February 13, 2026
- How to Avoid Surprises on Moving Day - February 11, 2026